Archive for the ‘Kubernetes’ Category
Kubernetes Troubleshooting in the Cloud
Kubernetes has been used by organizations for nearly a decade — from wrapping applications inside containers, pushing them to a container repository, to full production deployment.
At some point, we need to troubleshoot various issues in Kubernetes environments.
In this blog post, I will review some of the common ways to troubleshoot Kubernetes, based on the hyperscale cloud environments.
Common Kubernetes issues
Before we deep dive into Kubernetes troubleshooting, let us review some of the common Kubernetes errors:
- CrashLoopBackOff — A container in a pod keeps failing to start, so Kubernetes tries to restart it over and over, waiting longer each time. This usually means there’s a problem with the app, something important is missing, or the setup is wrong.
- ImagePullBackOff — Kubernetes can’t download the container image for a pod. This might happen if the image name or tag is wrong, there’s a problem logging into the image registry, or there are network issues.
- CreateContainerConfigError — Kubernetes can’t set up the container because there’s a problem with the settings like wrong environment variables, incorrect volume mounts, or security settings that don’t work.
- PodInitializing — A pod is stuck starting up, usually because the initial setup containers are failing, taking too long, or there are problems with the network or attached storage.
Kubectl for Kubernetes troubleshooting
Kubectl is the native and recommended way to manage Kubernetes, and among others to assist in troubleshooting various aspects of Kubernetes.
Below are some examples of using kubectl:
- View all pods and their statuses:
kubectl get pods
- Get detailed information and recent events for a specific pod:
kubectl describe pod <pod-name>
- View logs from a specific container in a multi-container pod:
kubectl logs <pod-name> -c <container-name>
- Open an interactive shell inside a running pod:
kubectl exec -it <pod-name> — /bin/bash
- Check the status of cluster nodes:
kubectl get nodes
- Get detailed information about a specific node:
kubectl describe node <node-name>
Additional information about kubectl can be found at:
https://kubernetes.io/docs/reference/kubectl
Remote connectivity to Kubernetes nodes
In rare cases, you may need to remotely connect a Kubernetes node as part of troubleshooting. Some of the reasons to do so may be troubleshooting hardware failures, collecting system-level logs, cleaning up disk space, restarting services, etc.
Below are secure ways to remotely connect to Kubernetes nodes:
- To connect to an Amazon EKS node using AWS Systems Manager Session Manager from the command line, use the following command:
aws ssm start-session — target <instance-id>
For more details, see: https://docs.aws.amazon.com/eks/latest/best-practices/protecting-the-infrastructure.html
- To connect to an Azure AKS node using Azure Bastion from the command line, run the commands below to get the private IP address of the AKS node and SSH from a bastion connected environment:
az aks machine list — resource-group <myResourceGroup> — cluster-name <myAKSCluster> \
— nodepool-name <nodepool1> -o table
ssh -i /path/to/private_key.pem azureuser@<node-private-ip>
For more details, see: https://learn.microsoft.com/en-us/azure/aks/node-access
- To connect to a GKE node using the gcloud command combined with Identity-Aware Proxy (IAP), use the following command:
gcloud compute ssh <GKE_NODE_NAME> — zone <ZONE> — tunnel-through-iap
For more details, see: https://cloud.google.com/compute/docs/connect/ssh-using-iap#gcloud
Monitoring and observability
To assist in troubleshooting, Kubernetes has various logs, some are enabled by default (such as container logs) and some need to be explicitly enabled (such as Control Plane logs).
Below are some of the ways to collect logs in managed Kubernetes services.
Amazon EKS
To collect EKS node and application logs, use CloudWatch Container Insights (including resource utilization), as explained below:
To collect EKS Control Plane logs to CloudWatch logs, follow the instructions below:
https://docs.aws.amazon.com/eks/latest/userguide/control-plane-logs.html
To collect metrics from the EKS cluster, use Amazon Managed Service for Prometheus, as explained below:
https://docs.aws.amazon.com/eks/latest/userguide/prometheus.html
Azure AKS
To collect AKS node and application logs (including resource utilization), use Azure Monitor Container Insights, as explained below:
To collect AKS Control Plane logs to Azure Monitor, configure the diagnostic setting, as explained below:
https://docs.azure.cn/en-us/aks/monitor-aks?tabs=cilium#aks-control-planeresource-logs
To collect metrics from the AKS cluster, use Azure Monitor managed service for Prometheus, as explained below:
Google GKE
GKE node and Pod logs are sent automatically to Google Cloud Logging, as documented below:
https://cloud.google.com/kubernetes-engine/docs/concepts/about-logs#collecting_logs
GKE Control Plane logs are not enabled by default, as documented below:
https://cloud.google.com/kubernetes-engine/docs/how-to/view-logs
To collect metrics from the GKE cluster, use Google Cloud Managed Service for Prometheus, as explained below:
https://cloud.google.com/stackdriver/docs/managed-prometheus/setup-managed
Enable GKE usage metering to collect resource utilization, as documented below:
https://cloud.google.com/kubernetes-engine/docs/how-to/cluster-usage-metering#enabling
Troubleshooting network connectivity issues
There may be various network-related issues when managing Kubernetes clusters. Some of the common network issues are nodes or pods not joining the cluster, inter-pod communication failures, connectivity to the Kubernetes API server, etc.
Below are some of the ways to troubleshoot network issues in managed Kubernetes services.
Amazon EKS
Enable network policy logs to investigate network connection through Amazon VPC CNI, as explained below:
https://docs.aws.amazon.com/eks/latest/userguide/network-policies-troubleshooting.html
Use the guide below for monitoring network performance issues in EKS:
Temporary enable VPC flow logs (due to high storage cost in large production environments) to query network traffic of EKS clusters deployed in a dedicated subnet, as explained below:
Azure AKS
Use the guide below to troubleshoot connectivity issues to the AKS API server:
Use the guide below to troubleshoot outbound connectivity issues from the AKS cluster:
Use the guide below to troubleshoot connectivity issues to applications deployed on top of AKS:
Use Container Network Observability to troubleshoot connectivity issues within an AKS cluster, as explained below:
https://learn.microsoft.com/en-us/azure/aks/container-network-observability-concepts
Google GKE
Use the guide below to troubleshoot network connectivity issues in GKE:
https://cloud.google.com/kubernetes-engine/docs/troubleshooting/connectivity-issues-in-cluster
Temporary enable VPC flow logs (due to high storage cost in large production environments) to query network traffic of GKR clusters deployed in a dedicated subnet, as explained below:
https://cloud.google.com/vpc/docs/using-flow-logs
Summary
I am sure there are many more topics to cover when troubleshooting problems with Kubernetes clusters, however, in this blog post, I highlighted the most common cases.
Kubernetes by itself is an entire domain of expertise and requires many hours to deep dive into and understand.
I strongly encourage anyone using Kubernetes to read vendors’ documentation, and practice in development environments, until you gain hands-on experience running production environments.
About the author
Eyal Estrin is a cloud and information security architect, an AWS Community Builder, and the author of the books Cloud Security Handbook and Security for Cloud Native Applications, with more than 20 years in the IT industry.
You can connect with him on social media (https://linktr.ee/eyalestrin).
Opinions are his own and not the views of his employer.
Kubernetes and Container Portability: Navigating Multi-Cloud Flexibility
For many years we have been told that one of the major advantages of using containers is portability, meaning, the ability to move our application between different platforms or even different cloud providers.
In this blog post, we will review some of the aspects of designing an architecture based on Kubernetes, allowing application portability between different cloud providers.
Before we begin the conversation, we need to recall that each cloud provider has its opinionated way of deploying and consuming services, with different APIs and different service capabilities.
There are multiple ways to design a workload, from traditional use of VMs to event-driven architectures using message queues and Function-as-a-Service.
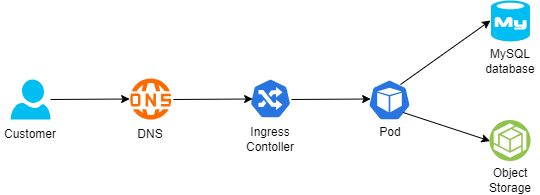
Below is an example of architecture:
- A customer connecting from the public Internet, resolving the DNS name from a global DNS service (such as Cloudflare)
- The request is sent to an Ingress controller, who forwards the traffic to a Kubernetes Pod exposing an application
- For static content retrieval, the application is using an object storage service through a Kubernetes CSI driver
- For persistent data storage, the application uses a backend-managed MySQL database
The 12-factor app methodology angle
When talking about the portability and design of modern applications, I always like to look back at the 12-factor app methodology:
Config
To be able to deploy immutable infrastructure on different cloud providers, we should store variables (such as SDLC stage, i.e., Dev, Test, Prod) and credentials (such as API keys, passwords, etc.) outside the containers.
Some examples:
- AWS Systems Manager Parameter Store (for environment variables or static credentials) or AWS Secrets Manager (for static credentials)
- Azure App Configuration (for environment variables or configuration settings) or Azure Key Vault (for static credentials)
- Google Config Controller (for configuration settings), Google Secret Manager (for static credentials), or GKE Workload Identity (for access to Cloud SQL or Google Cloud Storage)
- HashiCorp Vault (for environment variables or static credentials)
Backing services
To truly design for application portability between cloud providers, we need to architect our workload where a Pod can be attached and re-attached to a backend service.
For storage services, it is recommended to prefer services that Pods can connect via CSI drivers.
Some examples:
- Amazon S3 (for object storage), Amazon EBS (for block storage), or Amazon EFS (for NFS storage)
- Azure Blob (for object storage), Azure Disk (for block storage), or Azure Files (for NFS or CIFS storage)
- Google Cloud Storage (for object storage), Compute Engine Persistent Disks (for block storage), or Google Filestore (for NFS storage)
For database services, it is recommended to prefer open-source engines deployed in a managed service, instead of cloud opinionated databases.
Some examples:
- Amazon RDS for MySQL (for managed MySQL) or Amazon RDS for PostgreSQL (for managed PostgreSQL)
- Azure Database for MySQL (for managed MySQL) or Azure Database for PostgreSQL (for managed PostgreSQL)
- Google Cloud SQL for MySQL (for managed MySQL) or Google Cloud SQL for PostgreSQL (for managed PostgreSQL)
Port binding
To allow customers access to our application, Kubernetes exports a URL (i.e., DNS name) and a network port.
Since load-balancers offered by the cloud providers are opinionated to their eco-systems, we should use an open-source or third-party solution that will allow us to replace the ingress controller and enforce network policies (for example to be able to enforce both inbound and pod-to-pod communication), or a service mesh solution (for mTLS and full layer 7 traffic inspection and enforcement).
Some examples:
- NGINX (an open-source ingress controller), supported by Amazon EKS, Azure AKS, or Google GKE
- Calico CNI plugin (for enforcing network policies), supported by Amazon EKS, Azure AKS, or Google GKE
- Cilium CNI plugin (for enforcing network policies), supported by Amazon EKS, Azure AKS, or Google GKE
- Istio (for service mesh capabilities), supported by Amazon EKS, Azure AKS, or Google GKE
Logs
Although not directly related to container portability, logs are an essential part of application and infrastructure maintenance — to be specific observability, i.e., the ability to collect logs, metrics, and traces), to be able to anticipate issues before they impact customers.
Although each cloud provider has its own monitoring and observability services, it is recommended to consider open-source solutions, supported by all cloud providers, and stream logs to a central service, to be able to continue monitoring the workloads, regardless of the cloud platform.
Some examples:
- Prometheus — monitoring and alerting solution
- Grafana — visualization and alerting solution
- OpenTelemetry — a collection of tools for exporting telemetry data
Immutability
Although not directly mentioned in the 12 factors app methodology, to allow portability of containers between different Kubernetes environments, it is recommended to build a container image from scratch (i.e., avoid using cloud-specific container images), and package the minimum number of binaries and libraries. As previously mentioned, to create an immutable application, you should avoid storing credentials, or any other unique identifiers (including unique configurations) or data inside the container image.
Infrastructure as Code
Deployment of workloads using Infrastructure as Code, as part of a CI/CD pipeline, will allow deploying an entire workload (from pulling the latest container image, backend infrastructure, and Kubernetes deployment process) in a standard way between different cloud providers, and different SDLC stages (Dev, Test, Prod).
Some examples:
- OpenTofu — An open-source fork of Terraform, allows deploying entire cloud environments using Infrastructure as Code
- Helm Charts — An open-source solution for software deployment on top of Kubernetes
Summary
In this blog post, I have reviewed the concept of container portability for allowing organizations the ability to decrease the reliance on cloud provider opinionated solutions, by using open-source solutions.
Not all applications are suitable for portability, and there are many benefits of using cloud-opinionated solutions (such as serverless services), but for simple architectures, it is possible to design for application portability.
About the author
Eyal Estrin is a cloud and information security architect, an AWS Community Builder, and the author of the books Cloud Security Handbook and Security for Cloud Native Applications, with more than 20 years in the IT industry.
You can connect with him on social media (https://linktr.ee/eyalestrin).
Opinions are his own and not the views of his employer.
Introduction to Chaos Engineering

In the past couple of years, we hear the term “Chaos Engineering” in the context of cloud.
Mature organizations have already begun to embrace the concepts of chaos engineering, and perhaps the most famous use of chaos engineering began at Netflix when they developed Chaos Monkey.
To quote Werner Vogels, Amazon CTO: “Everything fails, all the time”.
What is chaos engineering and what are the benefits of using chaos engineering for increasing the resiliency and reliability of workloads in the public cloud?
What is Chaos Engineering?
“Chaos Engineering is the discipline of experimenting on a system to build confidence in the system’s capability to withstand turbulent conditions in production.” (Source: https://principlesofchaos.org)
Production workloads on large scale, are built from multiple services, creating distributed systems.
When we design large-scale workloads, we think about things such as:
- Creating high-available systems
- Creating disaster recovery plans
- Decreasing single point of failure
- Having the ability to scale up and down quickly according to the load on our application
One thing we usually do not stop to think about is the connectivity between various components of our application and what will happen in case of failure in one of the components of our application.
What will happen if, for example, a web server tries to access a backend database, and it will not be able to do so, due to network latency on the way to the backend database?
How will this affect our application and our customers?
What if we could test such scenarios on a live production environment, regularly?
Do we trust our application or workloads infrastructure so much, that we are willing to randomly take down parts of our infrastructure, just so we will know the effect on our application?
How will this affect the reliability of our application, and how will it allow us to build better applications?
History of Chaos Engineering
In 2010 Netflix developed a tool called “Chaos Monkey“, whose goal was to randomly take down compute services (such as virtual machines or containers), part of the Netflix production environment, and test the impact on the overall Netflix service experience.
In 2011 Netflix released a toolset called “The Simian Army“, which added more capabilities to the Chaos Monkey, from reliability, security, and resiliency (i.e., Chaos Kong which simulates an entire AWS region going down).
In 2012, Chaos Monkey became an open-source project (under Apache 2.0 license).
In 2016, a company called Gremlin released the first “Failure-as-a-Service” platform.
In 2017, the LitmusChaos project was announced, which provides chaos jobs in Kubernetes.
In 2019, Alibaba Cloud announced ChaosBlade, an open-source Chaos Engineering tool.
In 2020, Chaos Mesh 1.0 was announced as generally available, an open-source cloud-native chaos engineering platform.
In 2021, AWS announced the general availability of AWS Fault Injection Simulator, a fully managed service to run controlled experiments.
In 2021, Azure announced the public preview of Azure Chaos Studio.
What exactly is Chaos Engineering?
Chaos Engineering is about experimentation based on real-world hypotheses.
Think about Chaos Engineering, as one of the tests you run as part of a CI/CD pipeline, but instead of a unit test or user acceptance test, you inject controlled faults into the system to measure its resiliency.
Chaos Engineering can be used for both modern cloud-native applications (built on top of Kubernetes) and for the legacy monolith, to achieve the same result – answering the question – will my system or application survive a failure?
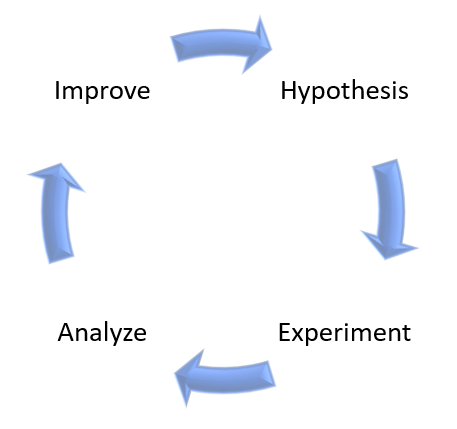
On high-level, Chaos Engineering is made of the following steps:
- Create a hypothesis
- Run an experiment
- Analyze the results
- Improve system resiliency
As an example, here is AWS’s point of view regarding the shared responsibility model, in the context of resiliency:
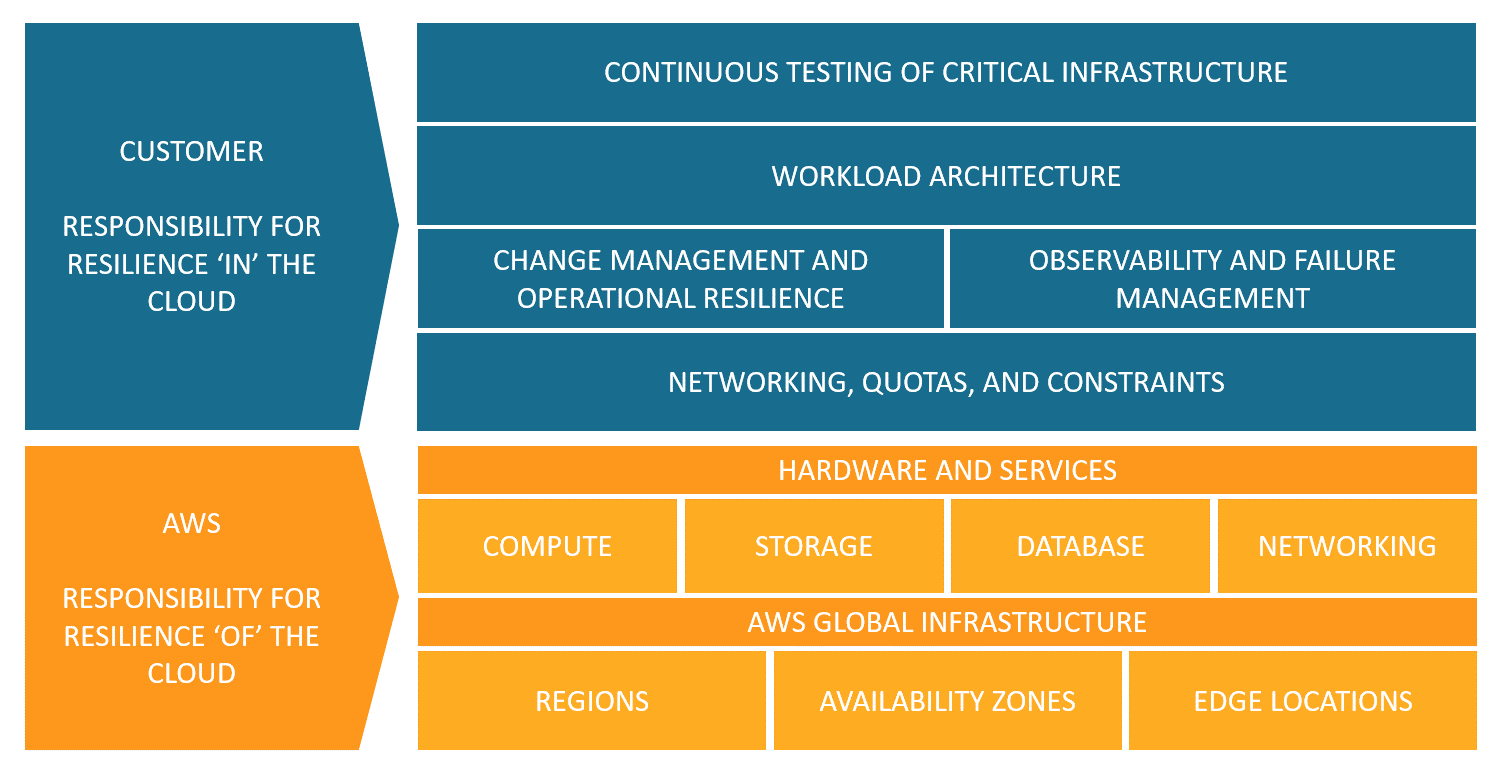
Source: https://aws.amazon.com/blogs/architecture/chaos-engineering-in-the-cloud
Chaos Engineering managed platform comparison
In the table below we can see a comparison between AWS and Azure-managed services for running Chaos Engineering experiments:

Additional References:
Summary
In this post, I have explained the concept of Chaos Engineering and compared alternatives to cloud-managed services.
Using Chaos Engineering as part of a regular development process will allow you to increase the resiliency of your applications, by studying the effect of failures and designing recovery processes.
Chaos Engineering can also be used as part of a disaster recovery and business continuity process, by testing the resiliency of your systems.
Additional References
- Chaos engineering (Wikipedia)
- Principles of Chaos Engineering
- Chaos Engineering in the Cloud
- What Chaos Engineering Is (and is not)
- AWS re:Invent 2022 – The evolution of chaos engineering at Netflix (NFX303)
- What is AWS Fault Injection Simulator?
- What is Azure Chaos Studio?
- Public Chaos Engineering Stories / Implementations
Introduction to Day 2 Kubernetes

Over the years, I have shared several blog posts about Kubernetes (What are Containers and Kubernetes, Modern Cloud deployment and usage, Introduction to Container Operating Systems, and more).
Kubernetes became a de-facto standard for running container-based workloads (for both on-premise and the public cloud), but most organizations tend to fail on what is referred to as Day 2 Kubernetes operations.
In this blog post, I will review what it means “Day 2 Kubernetes” and how to prepare your workloads for the challenges of Day 2 operations.
Ready, Set, Go!
In the software lifecycle, or the context of this post, the Kubernetes lifecycle, there are several distinct stages:
Day 0 – Planning and Design
In this stage, we focus on designing our solution (application and underlying infrastructure), understanding business needs, budget, required skills, and more.
For the context of this post, let us assume we have decided to build a cloud-native application, made of containers, deployed on top of Kubernetes.
Day 1 – Configuration and Deployment
In this stage, we focus on deploying our application using the Kubernetes orchestrator and setting up the configurations (number of replicas, public ports, auto-scale settings, and more).
Most organizations taking their first steps deploying applications on Kubernetes are stacked at this stage.
They may have multiple environments (such as Dev, Test, UAT) and perhaps even production workloads, but they are still on Day 1.
Day 2 – Operations
Mature organizations have reached this stage.
This is about ongoing maintenance, observability, and continuous improvement of security aspects of production workloads.
In this blog post, I will dive into “Day 2 Kubernetes”.
Day 2 Kubernetes challenges
Below are the most common Kubernetes challenges:
Observability
Managing Kubernetes at a large scale requires insights into the Kubernetes cluster(s).
It is not enough to monitor the Kubernetes cluster by collecting performance logs, errors, or configuration changes (such as Nodes, Pods, containers, etc.)
We need to have the ability to truly understand the internals of the Kubernetes cluster (from logs, metrics, etc.), be able to diagnose the behavior of the Kubernetes cluster – not just performance issues, but also debug problems, detect anomalies, and (hopefully) be able to anticipate problems before they affect customers.
Prefer to use cloud-native monitoring and observability tools to monitor Kubernetes clusters.
Without proper observability, we will not be able to do root cause analysis and understand problems with our Kubernetes cluster or with our application deployed on top of Kubernetes.
Common tools for observability:
- Prometheus – An open-source systems monitoring and alerting toolkit for monitoring large cloud-native deployments.
- Grafana – An open-source query, visualization, and alerting tool (resource usage, built-in and customized metrics, alerts, dashboards, log correlation, etc.)
- OpenTelemetry – A collection of open-source tools for collecting and exporting telemetry data (metrics, logs, and traces) for analyzing software performance and behavior.
Additional references for managed services:
- Amazon Managed Grafana
- Amazon Managed Service for Prometheus
- AWS Distro for OpenTelemetry
- Azure Monitor managed service for Prometheus (Still in preview on April 2023)
- Azure Managed Grafana
- OpenTelemetry with Azure Monitor
- Google Cloud Managed Service for Prometheus
- Google Cloud Logging plugin for Grafana
- OpenTelemetry Collector (Part of Google Cloud operations suite)
Security and Governance
On the one hand, it is easy to deploy a Kubernetes cluster in private mode, meaning, the API server or the Pods are on an internal subnet and not directly exposed to customers.
On the other hand, many challenges in the security domain need to be solved:
- Secrets Management – A central and secure vault for generating, storing, retrieving, rotating, and eventually revoking secrets (instead of hard-coded static credentials inside our code or configuration files).
- Access control mechanisms – Ability to control what persona (either human or service account) has access to which resources inside the Kubernetes cluster and to take what actions, using RBAC (Role-based access control) mechanisms.
- Software vulnerabilities – Any vulnerabilities related to code – from programming languages (such as Java, PHP, .NET, NodeJS, etc.), use of open-source libraries with known vulnerabilities, to vulnerabilities inside Infrastructure-as-Code (such as Terraform modules)
- Hardening – Ability to deploy a Kubernetes cluster at scale, using secured configuration, such as CIS Benchmarks.
- Networking – Ability to set isolation between different Kubernetes clusters or even between different development teams using the same cluster, not to mention multi-tenancy where using the same Kubernetes platform to serve different customers.
Additional Reference:
- Securing the Software Supply Chain in the Cloud
- OPA (Open Policy Agent) Gatekeeper
- Kyverno – Kubernetes Native Policy Management
- Foundational Cloud Security with CIS Benchmarks
- Amazon EKS Best Practices Guide for Security
- Azure security baseline for Azure Kubernetes Service (AKS)
- GKE Security Overview
Developers experience
Mature organizations have already embraced DevOps methodologies for pushing code through a CI/CD pipeline.
The entire process needs to be done automatically and without direct access of developers to production environments (for this purpose you build break-glass mechanisms for the SRE teams).
The switch to applications wrapped inside containers, allowed developers to develop locally or in the cloud and push new versions of their code to various environments (such as Dev, Test, and Prod).
Integration of CI/CD pipeline, together with containers, allows organizations to continuously develop new software versions, but it requires expanding the knowledge of developers using training.
The use of GitOps and tools such as Argo CD allowed a continuous delivery process for Kubernetes environments.
To allow developers, the best experience, you need to integrate the CI/CD process into the development environment, allowing the development team the same experience as developing any other application, as they used to do in the on-premise for legacy applications, which can speed the developer onboarding process.
Additional References:
- GitOps 101: What is it all about?
- Argo CD – Declarative GitOps CD for Kubernetes
- Continuous Deployment and GitOps delivery with Amazon EKS Blueprints and ArgoCD
- Getting started with GitOps, Argo, and Azure Kubernetes Service
- Building a Fleet of GKE clusters with ArgoCD
Storage
Any Kubernetes cluster requires persistent storage – whether organizations choose to begin with an on-premise Kubernetes cluster and migrate to the public cloud, or provision a Kubernetes cluster using a managed service in the cloud.
Kubernetes supports multiple types of persistent storage – from object storage (such as Azure Blob storage or Google Cloud Storage), block storage (such as Amazon EBS, Azure Disk, or Google Persistent Disk), or file sharing storage (such as Amazon EFS, Azure Files or Google Cloud Filestore).
The fact that each cloud provider has its implementation of persistent storage adds to the complexity of storage management, not to mention a scenario where an organization is provisioning Kubernetes clusters over several cloud providers.
To succeed in managing Kubernetes clusters over a long period, knowing which storage type to use for each scenario, requires storage expertise.
High Availability
High availability is a common requirement for any production workload.
The fact that we need to maintain multiple Kubernetes clusters (for example one cluster per environment such as Dev, Test, and Prod) and sometimes on top of multiple cloud providers, make things challenging.
We need to design in advance where to provision our cluster(s), thinking about constraints such as multiple availability zones, and sometimes thinking about how to provision multiple Kubernetes clusters in different regions, while keeping HA requirements, configurations, secrets management, and more.
Designing and maintaining HA in Kubernetes clusters requires a deep understanding of Kubernetes internals, combined with knowledge about specific cloud providers’ Kubernetes management plane.
Additional References:
- Designing Production Workloads in the Cloud
- Amazon EKS Best Practices Guide for Reliability
- AKS – High availability Kubernetes cluster pattern
- GKE best practices: Designing and building highly available clusters
Cost optimization
Cost is an important factor in managing environments in the cloud.
It can be very challenging to design and maintain multiple Kubernetes clusters while trying to optimize costs.
To monitor cost, we need to deploy cost management tools (either the basic services provided by the cloud provider) or third-party dedicated cost management tools.
For each Kubernetes cluster, we need to decide on node instance size (amount of CPU/Memory), and over time, we need to review the node utilization and try to right-size the instance type.
For non-production clusters (such as Dev or Test), we need to understand from the cloud vendor documentation, what are our options to scale the cluster size to the minimum, when not in use, and be able to spin it back up, when required.
Each cloud provider has its pricing options for provisioning Kubernetes clusters – for example, we might want to choose reserved instances or saving plans for production clusters that will be running 24/7, while for temporary Dev or Test environment, we might want to choose Spot instances and save cost.
Additional References:
- Cost optimization for Kubernetes on AWS
- Azure Kubernetes Service (AKS) – Cost Optimization Techniques
- Best practices for running cost-optimized Kubernetes applications on GKE
- 5 steps to bringing Kubernetes costs in line
- 4 Strategies for Kubernetes Cost Reduction
Knowledge gap
Running Kubernetes clusters requires a lot of knowledge.
From the design, provision, and maintenance, usually done by DevOps or experienced cloud engineers, to the deployment of new applications, usually done by development teams.
It is crucial to invest in employee training, in all aspects of Kubernetes.
Constant updates using vendor documentation, online courses, blog posts, meetups, and technical conferences will enable teams to gain the knowledge required to keep up with Kubernetes updates and changes.
Additional References:
- Kubernetes Blog
- AWS Containers Blog
- Azure Kubernetes Service (AKS) issue and feature tracking
- Google Cloud Blog – Containers & Kubernetes
Third-party integration
Kubernetes solve part of the problems related to container orchestration.
As an open-source solution, it can integrate with other open-source complimentary solutions (from monitoring, security and governance, cost management, and more).
Every organization might wish to use a different set of tools to achieve each task relating to the ongoing maintenance of the Kubernetes cluster or for application deployment.
Selecting the right tools can be challenging as well, due to various business or technological requirements.
It is recommended to evaluate and select Kubernetes native tools to achieve the previously mentioned tasks or resolve the mentioned challenges.
Summary
In this blog post, I have reviewed the most common Day 2 Kubernetes challenges.
I cannot stress enough the importance of employee training in deploying and maintaining Kubernetes clusters.
It is highly recommended to evaluate and look for a centralized management platform for deploying, monitoring (using cloud-native tools), and securing the entire fleet of Kubernetes clusters in the organization.
Another important recommendation is to invest in automation – from policy enforcement to application deployment and upgrade, as part of the CI/CD pipeline.
I recommend you continue learning and expanding your knowledge in the ongoing changed world of Kubernetes.
